

Sponsored: Broadcast Sport speaks to CricViz about how coverage of the game is evolving through its data and new analysis tools
The Hundred in the UK, and a proliferation of T20 competitions around the world, have seen cricket target new audiences as it aims to grow the game. How is TV coverage evolving with the game?
For CricViz managing director Michael Kivido, the broadcast experience is changing to adapt to these audiences, and needs to continue doing so: “The new audiences that are coming to cricket, and cricket wants to attract, are used to consuming content in a very different way to how previous generations were.”
“It’s an expectation to have data driven insights in the broadcast, and so to capture those audiences you have to meet that expectation.”
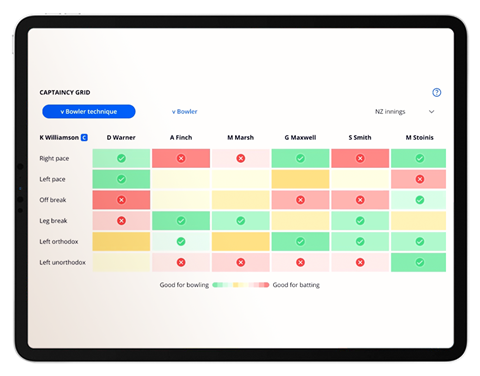
Working towards this is CricViz’s Centurion product, a portal to cricket’s largest database that offers an integrated data and video archive, generates insights and visualisations and uses official third-party ball tracking to analyse speeds, lines, lengths and everything in between to understand the strengths and weaknesses of every player.
CricViz, which is part of sport data business Ellipse, began by making tools for teams and players, and Kivido explained, “We’re really proud of our credentials and roots in that space, but CricViz has come a long way. We’ve still got a strong brand in performance, but now also in broadcast and media. Centurion is flexible enough to add a lot of value to both verticals.” This has resulted in CricViz, “working with new clients within broadcast. For example, Disney Star in India, who we supported in this year’s IPL, as well as the Men’s T20 World Cup.”
It’s of particular use for commentary and pre-, mid- or post-match analysis, with Ben Jones, head of insight at CricViz, who works with the likes of the BBC and others on their coverage, explaining, “Commentators can’t be across every player. Being able to search an uncapped Bangladeshi right arm seamer and immediately access all the cricket they’ve ever played professionally, watch video of them, and get a sense of who they are is invaluable.”
CricViz product director Fred Clarke added, “We have all of the basic data that would be freely available online, but we also have our bespoke AI-driven proprietary data insights, as well as our own visualisations that we’ve crafted, and ways for the user to query and filter and analyse the data in whatever way that they want to.”
Jones has worked alongside commentary teams around the world with this tool and believes accessing data at speed is key for productions, “It’s more like how you would engage with a game if you were sitting in a pub and thought, ‘that seems a bit unusual.’ Analysis can be driven organically, rather than trying to preordain a narrative.”
Removing the need to plan analysis so far ahead of time can add dynamism to a broadcast. Jones revealed: “I was at a game in St. Lucia with [former West Indies international & now presenter/commentator] Ian Bishop, and I happened to click on a beehive of a bowler’s lengths. He was shocked, and said, ‘That’s definitely shorter than this bowler normally bowls.’ I looked at the historical data and it was the shortest he’d ever bowled at this venue in T20 cricket. Ian could then go next door and ask for a graphic to be built to show this, and suddenly there was a three-minute piece of analysis on air.”
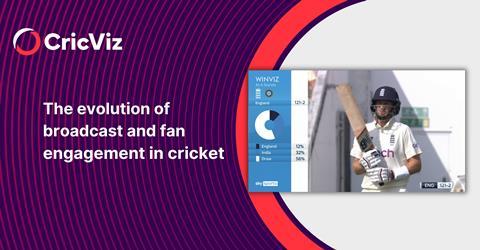
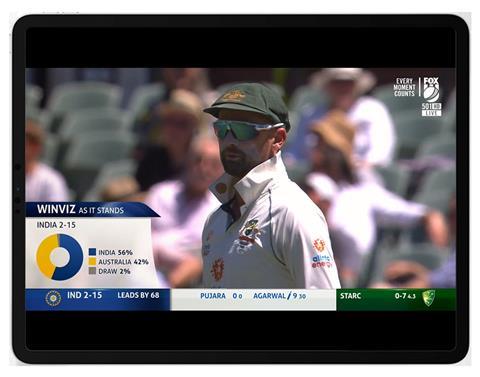
This helps to explain the game to new audiences. Speaking from the broadcast of a Hundred match, a competition which completely redesigned cricket’s traditional graphics to try and make them more approachable for new fans, Jones accepted, “There is no more simple story than who is winning, but, for cricket, over the last 150 years it has probably been the hardest question to answer.” WinViz, which is used by Sky Sports’ cricket coverage and included in Centurion, was created by CricViz with the aim of making this clearer – giving viewers a clear percentage of how likely each side is to win the game at that point.
Clarke said on the topic, “A big part of what we’re trying to do is use data science to come out with new metrics that help explain what’s happening in the game, and to try to present that in as simple a way as possible so that the average fan will understand.”
Kivido added, “As interest in the game continues to grow, people want to engage more and understand more of the game. CricViz is continuously investing in new, innovative ways of explaining to people what’s happening within the game, uncovering ways to really add value for storytellers across all formats of the game.”
With cricket continuing to grow its support around the globe such as with The Hundred, and pushing to continue to do this through efforts such as joining the LA 2028 Olympics, the use of data and tools such as Centurion to explain the game to new and existing audiences is sure to keep growing. To learn more about the evolution of broadcast, join Ellipse, the parent company of CricViz, FootballViz, TennisViz and RugbyViz, at the Broadcast Sport Summit on 13 November. Tickets are available here.


No comments yet