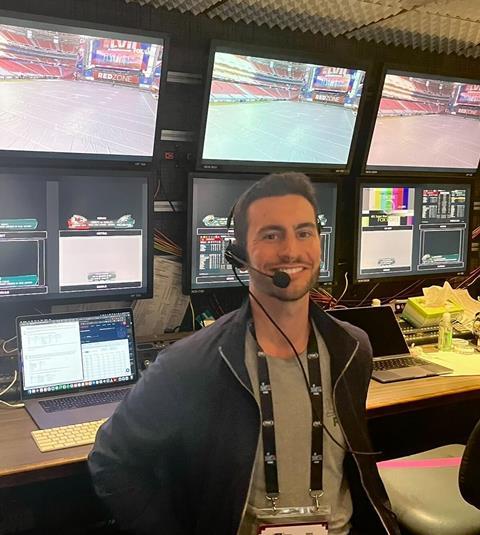
Zach Robinow, Sportradar senior research analyst, speaks to Broadcast Sport after working with Fox Sports on its Super Bowl coverage

Last month saw one of the greatest comebacks in Super Bowl history, the Kansas City Chiefs overcoming a 24-14 deficit to the Philadelphia Eagles at halftime to win 35-38.
For Zach Robinow, Sportradar senior research analyst, who has worked with Fox Sports on statistics for their US broadcasts of the event for the past five years, this meant a particularly busy Sunday afternoon on the job. He spoke to Broadcast Sport about how the US broadcaster and Sportradar work to enhance coverage with statistics and graphics for the big game.

He explained: “For us it starts as soon as the NFC Championship game finishes two weeks prior. I immediately start getting to work on our game notes. I compile the best stuff I can come up with, from every angle I can find – matchup tidbits, trends, what these teams are good at, what they’re not good at, how those might interplay against each other, everything I can come up with. Super Bowl notes are an extra long set. I got that out to them the Friday before the Super Bowl week, then I headed out to Phoenix [Arizona], the Monday before the Super Bowl.”
Once it gets to the week of the game, Robinow is on location to prepare the broadcast: “I was in the truck right outside the stadium all day Wednesday, Thursday, Friday, Saturday, and Sunday, making sure there’s no stone left unturned. I’m working with the Fox team, the graphic producers and the talents, to come up with, where we might want to go Obviously, you can’t predict everything about where the game is going to go, but you can certainly be prepared for anywhere it might go. We create a huge catalogue of graphics ahead of time. We do that for every game, but for the Super Bowl extra time and extra eyeballs, so you have to make sure every T is crossed and every I dotted.
“On the day we got there at about 8am and the game kicked off at 4:30pm local time – and we’re still creating graphics right up to then. We had had a production meeting the night before with all the talent and the producers and the directors, and there’s certain things that that the announcers say they might want to want to talk about and I come up with last second things to try to support that.”
Creating graphics for a Super Bowl audience brings up different challenges than a regular season game, with viewers who may not watch American football very often tuning in for the first time. Robinow said: ”I’ve worked with this crew long enough that I know the types of things that are likely to get in the broadcast. There’s certain things that would never make a broadcast, and especially a Superbowl broadcast, because the further along we get in the playoffs, the bigger the game gets, the more eyeballs on it, the more you have to make it easier to digest for a lay audience. You have to tell really concise, easy to digest stories if you’re going to use a graphic. That doesn’t mean that I’m not providing the more nitty gritty stuff, especially to someone like [former NFL player and now pundit] Greg [Olsen]. He loves all those numbers, and even if it’s not going to be a graphic, he might allude to it verbally. It helps give a factual basis for the types of things he’s talking about.”
Audiences are becoming more open to analytics, Robinow believes: “Everyone is starting to become more open to a little more advanced analytics. There’s definitely some kind of older school football folks who are more against it. They definitely don’t want to inundate a broadcast with that sort of thing because it doesn’t appeal to everyone, but there’s definitely more and more of it.”

Data points can also now illustrate parts of the game which before had been difficult to measure. For example, the Eagles’ offensive line is known to be one of the best, but it had been hard to show that through numbers. “They’re extremely talented, but it can be hard to find a way to statistically portray how well an offensive line is playing. We had a great stat, that the broadcast crew loved but didn’t ultimately end up making it because the timing didn’t work out. It was about the percentage of their rushing yards that were before contact. That’s a data point in our database, and for the Eagles over 70% of the rushing yards this season were before contact. Their offensive line is creating such massive holes for the running backs that they’re not even getting touched.”
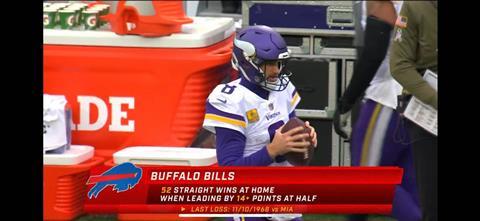
However, even after finding what might be the perfect statistic, it won’t always make into the broadcast. Robinow said: “It totally depends how the broadcast is going. There’s cool stats, or stuff that I might think is cool as a stats guy, but that might not align with the incentives of their broadcasts. For instance, at halftime Kansas City was down 10, and we uncovered a nugget that said for teams down 10 or more at halftime one in 26 in Super Bowl history have gone on to win.
“We’re probably not going to show that graphic, as interesting as I might find it, because we don’t want people to tune out. It turns out Kansas City did ultimately come back, and that’s kind of how we’re thinking of it - you know, ‘won’t it be amazing when they come back and win this given how rare that’s happened’. But that’s not something that even made it in, and tonnes of great things do get left on the cutting room floor, especially in a game like this. Whether it doesn’t align with the broadcast incentives, or whether the only time that it might have worked they had some other obligation they have to show - some other pre-packaged content.”


No comments yet