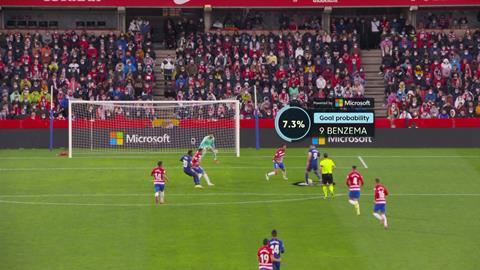
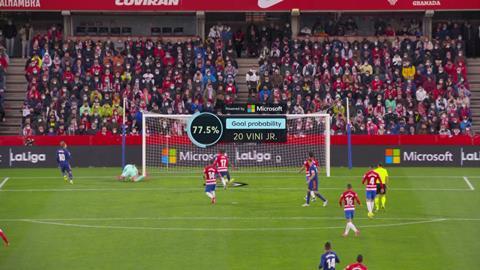
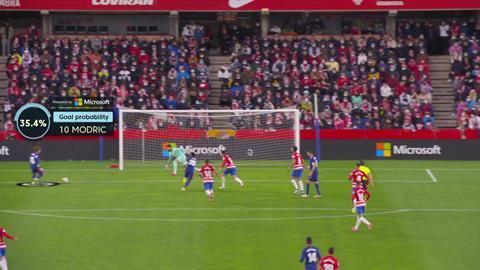
The graphics are shown in goal replays, providing insight into the likelihood of each player being able to score from their position

LaLiga is adding near real-time goal probability graphics to its broadcasts, through a partnership with Microsoft Azure’s artificial intelligence and machine learning.
The stat is created in 30-seconds enabling the graphics to be included in goal replays. The data reveals what LaLiga calls a “goalscoring efficiency variable”, which is based on information such as the positioning of both teams’ players.
The graphic makes it possible for fans to see likely each player was to score from their position during the lead up to a goal.
With this, fans watching on will be able to see and understand first hand just how good a goalscoring chance actually was, helping to explain how efficient the players are in their finishing.
The Goal Probability graphic is the latest development in LaLiga’s agreement with Microsoft – named the Beyond Stats project – with work underway on around 21 new metrics and other developments to be rolled out during 2022. These projects include the next-generation of OTT streaming services; advanced content protection services; and venue management systems.
The Goal Probability graphics will be shown in national and international broadcasts.
LaLiga is the first among European leagues to launch this metric during goal replays (specifically, the second replays).

LaLiga’s in-house Mediacoach platform is behind the data capture for the Goal Probability stat. Mediacoach is capable of capturing almost 3.5 million positioning data points per match, which translates into some 2,000 metrics per player.
As well as the stats around the current goalscoring opportunity, the graphic can incorporate, almost in real time, the player’s historic stats into the broadcast during the second replays of a goal.
LaLiga Tech general director Miguel Ángel Leal said: “Fans increasingly want a more personalised experience and quality information that helps them to interpret and enjoy the game, something we are working on through the Beyond Stats project, both on the website and with the ‘Powered by Microsoft’ graphics shown in broadcasts. The work being carried out by our team of data scientists at LaLiga Tech, as part of our alliance with Microsoft, makes it possible to present innovations that are pioneering in the industry, such as this sophisticated Goal Probability model.”
Rebeca Marciel, enterprise commercial lead at Microsoft Spain, added: “Microsoft’s machine learning and artificial intelligence technology has facilitated this development, thanks to the analysis of historical tracking data of more than 20,000 shots obtained from some 2,000 matches. The capacity of this technology has allowed LaLiga to take another step forward, becoming the first league to bring a metric with these characteristics into its broadcasts.”
Goal Probability – How does it work?

During a match, real-time data on the positioning of the players is received via 16 optical tracking cameras that are installed in each stadium of the league. From there, each parameter is calculated, with the Goal Probability metric based on a variety of different variables, such as the player’s line of sight, which considers the positions of the opposition players in the way of the player’s view to goal, which has a decisive impact on the difficulty and, in turn, the probability of finishing the chance. Other factors taken into consideration include the distance between the ball and the goalkeeper and between the ball and the goal, or the distance and angle to the nearest defender. This produces a final stat that is shown on the screen. The model returns probabilities between 0% and 100%, providing the viewer with an insight into the golden opportunities that were wasted, or the goals that were scored from a nearly impossible position. The figure shown will also take into consideration the goalscoring efficiency of the player in question.


No comments yet