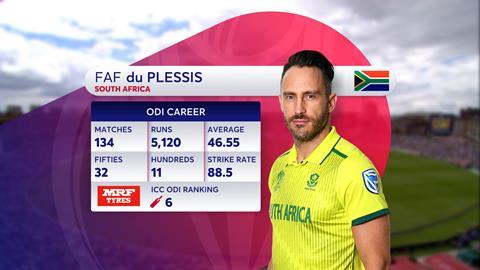
Detailed historical stats, live performance data and advanced on-screen graphics are playing an enhanced role in bringing the Cricket World Cup to life

The extensive facts and figures shown during the televised coverage of the Cricket World Cup, as well as the plethora of stats used behind the scenes, surpasses anything created before for the tournament.
AE Graphics has four crews of six-strong cricket specialists on-site at every fixture of the Cricket World Cup. They are responsible for delivering core match graphics from data collected at every stadium. The team are also creating Augmented Reality (AR) content, making use of the Spidercam and its vector system at selected venues.
It’s also providing big-screen graphics and a range of presentation graphics for Sky Sports and Star Sports India during high-profile fixtures, including multi-language feeds, which are being produced remotely at Star’s production hub in Mumbai.
On top of this, AE Graphics is delivering player tracking graphics using ChyronHego’s Tracab optical tracking application. The graphics show viewers the exact field position of players as well as a range of data points, including running speed and distances covered.
The design for the on-screen and presentation graphics – including analytics graphics, AR and player tracking graphics – have been overhauled by AE Graphics. The company built 100+ graphics templates in Vizrt for the world feed, including a non-branded version of the graphics for matches in India where there are advertising restrictions.
It’s the sixth Cricket World Cup the graphics and data company has worked on, having first created the world feed and presentation graphics for various rights holders for the 1996 event.
AE Graphics, which was formerly known as Alston Elliot, won the graphics design contract after a competitive tender process with the ICC.
AE Graphics creative director Oliver Pearson, said: “We have developed a design that takes the core brand principles and is vibrant, smart and dynamic with burst of colour. The composition and graphical elements keep things simple and make sure that the most important information is easy to pick out.”
Data-powered insights
Also providing stats for the Cricket World Cup is Perform’s sports data provider Opta. Before every fixture, Opta picks out relevant “straightforward and niche” stats from its extensive historical database. The aim is to help those covering the action with their pre-game preparation, and the data is also being used across broadcast, digital, social and traditional media.
An official tournament scorer from Opta is on location at each cricket ground to accurately record the action as it happens, supported by a team of analysts capturing data from a dedicated collection hub.
Another Opta expert – in the press box – is on hand to deliver data-powered insights as the action unfolds.
Opta central data editor Dan Atherton told Broadcast Sport: “As a batsman reaches a career milestone, a bowler achieves a record wicket-haul or a team closes in on qualification, the stadium announcer can rely on Opta to provide the detail for them to share with all those enjoying the game in person. These live insights are also there to be shared with those bringing the action to fans watching and following around the world.”
Meanwhile, Opta is also providing stats to teams behind-the-scenes, with its Net Run Rate Calculator ensuring players are clear on their required scoring rate.


No comments yet